About
Installation
Licence
Changelog
Screenshot
Performance
Documentation
users_guide [ps]
users_guide [pdf]
users_guide [lyx]
Download
Source
Current version:
jmp.tar.gz
Other versions
jmp-0.51.1.tar.gz
jmp-0.50.2.tar.gz
jmp/0.18, gtk/1.2
jmp-0.18.tar.gz
Binaries
jmp.deb [0.48, i386]
jmp.deb [0.42, amd64]
jmp.deb [0.48, ppc]
jmp.dll
gtk+/2.2.0 Win32
Old versions
Contacts
Robert Olofsson
robo@khelekore.org
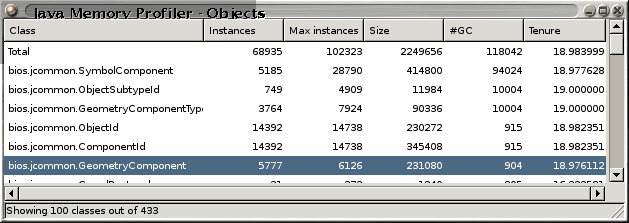
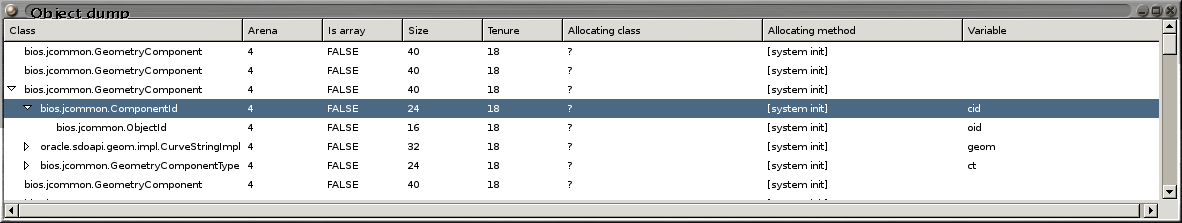
The first image show what objects there are in memory.
The meaning of the columns are:
| Class | The class that has instances. |
| instances | The current number of allocated instances. |
| max instances | The maximum simultanious number of allocated instances. |
| Size | The current number of bytes instances of this class use. |
| #GC | The number of instances of this class that have been garbage collected. |
| Tenure | The average number of GCs that the instances have survived |
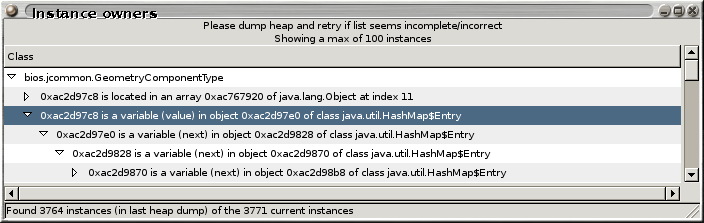
This image shows how object connect to each other. Finding the owner to objects is the easy way to find memory leaks.
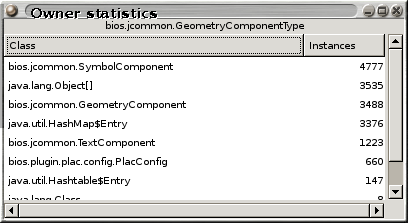
Here we can see a summary of who it is that holds references to objects of a given class.
This image shows the non-null links in a few objects. Using this it is quite easy to see how large the data structures are. Instances can be inspected by selecting "inspecte instance" in the right-click menu.
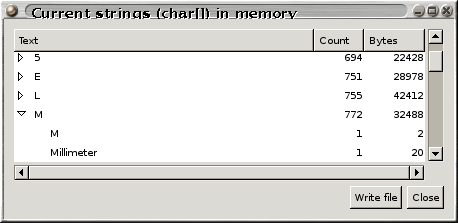
Strings are a common cause of high memory usage in java. So it is nice to to see if there are dupliate strings in memory. JMP can open a window that shows all strings (well, actually all the char[]) in memory so that you can see which strings that occurs multiple times.
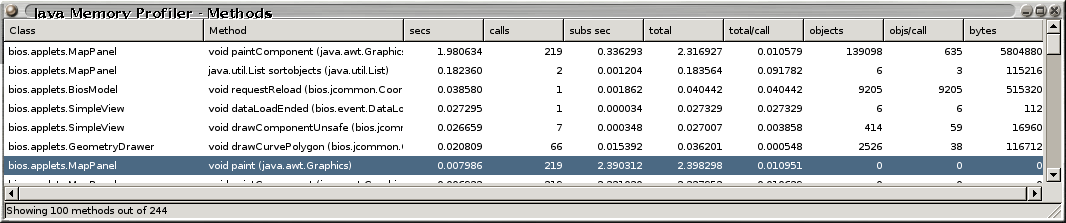
In the next image we can see where the java program is spending time. The columns I value the most are the secs and calls. Note! The time used is real time, so if you have 10 threads and your application is running for 60 seconds you should see a total time of 600 seconds used.
The meaning of the columns are:
| Class | The class that holds the method. |
| method | The method that takes time. |
| secs | The number of seconds that this method has used. |
| calls | The number of calls to this method. |
| subs sec | The number of seconds that methods called from this method has taken. Recursive methods can show up big time here. |
| Total | The sum of secs and subs secs. |
| Total/call | The average time spend per call to this method. |
| objects | The number of instances this method has allocated. |
| objects/call | The average number of instances this method allocates. |
| bytes | The number of bytes this method has allocated. |
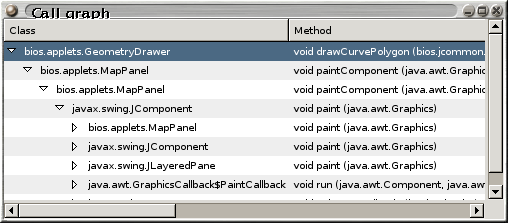
Here is a method call graph.
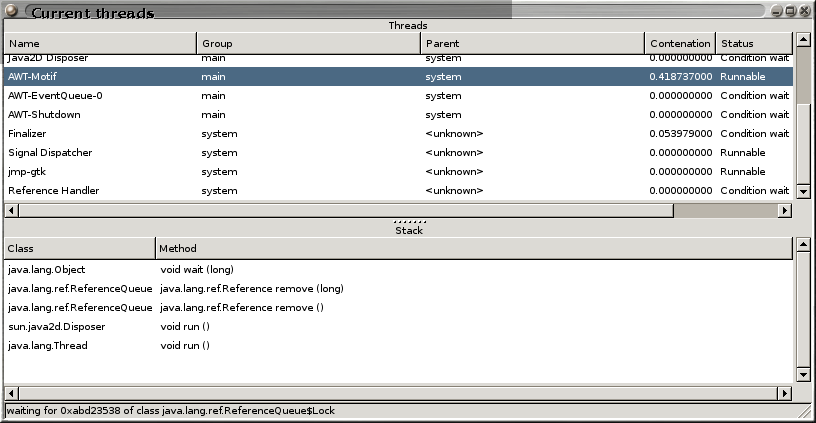
Here is a window showing all the threads in the system.
| Name | The name of the threads. |
| Group | The group of the thread. |
| Parent | The parent of the thread. |
| Contenation | The time this thread has spent waiting for a monitor. |
| Status | The current status of the thread. |
| Time | How much time this thread has used. |
| Class | The class of the stack trace element. |
| Method | The method of the stack trace element. |
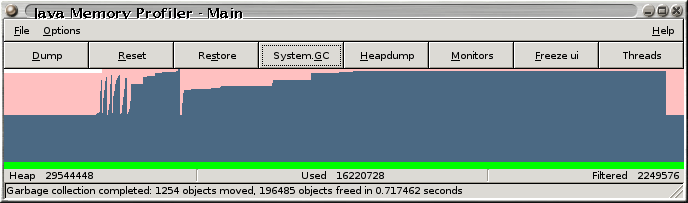
Here is the main control window. The graph show how much memory is allocated to the
java heap (pink), used heap memory (blue)
and how much of that memory is used by the currently filtered set (green).
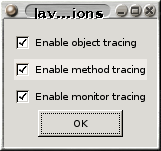
Here you can see what types of event that can be enabled and disabled at runtime.
This means that you can start jmp without tracing anything heavy and then start
profiling when your application has reached a state where profiling is wanted.
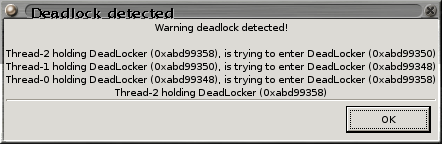
This is a window that shows the monitors that exists in the jvm at a given moment.
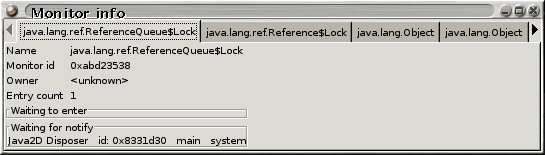
And here we can see that jmp has detected a deadlock situation